
Everyone knows the joke about colleges using BIPOC students, staff and faculty as pictures on their publications. I mean, why wouldn’t you when you want to tout your campus’ diversity? This wouldn’t be an issue if the campus was actually diverse, but when a school is using it to overrepresent their campus diversity, it becomes tokenizing and harmful.
This tokenization could be seen as an innocent photo with no ulterior motive, but NC State takes it one step further by skewing their diversity data and misleading potential incoming students. I think it’s safe to say the misleading is intentional.
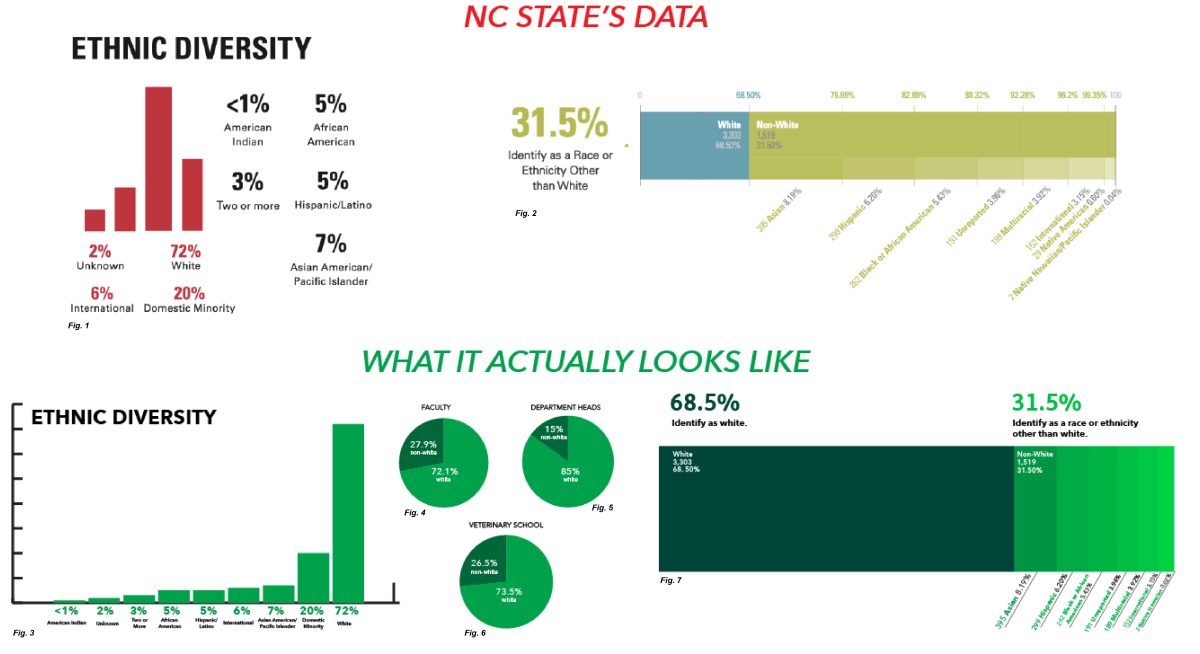
Ever since it was released, the diversity graphic on the 2019 Undergraduate Admissions First Year Facts sheet has bothered me. Figure 2 is presented on the fact sheet, showing that 31.5% of NC State students identify as a race or ethnicity other than white. The graph then breaks down the nonwhite category into individual racial and ethnic minorities. However, the graph deliberately presents the nonwhite category as larger than the white category and uses small percentages to mislead a careless reader into believing NC State has drastically more BIPOC students than it does. The graph should actually look like Figure 7.
After noticing this, I began to wonder if this technique is used by other campus publications. It wasn’t long before I found a report on diversity in Poole College of Management. Figure 1 in the original report shows a bar chart that is not in any way representative of the actual statistics that are presented. Furthermore, the report presents the 72% white statistic as much smaller than the other percentages for racial and ethnic minorities. If they chose to use a bar chart, the data should be presented like Figure 3, with racial and ethnic minority groups being a subcategory of “domestic minority.”
In January of 2019, the College of Veterinary Medicine put out a publication on the college’s diversity, and it is filled with wonderful pictures of BIPOC students, staff and faculty and their families, but it never once actually talks about the diversity statistics of the college. According to NC State’s Institutional Strategy and Analysis (ISA) office, the College of Veterinary Medicine is 26.5% nonwhite and 73.5% white, less diverse than the rest of the school. This could be presented like Figure 6.
Furthermore, NC State, like any other university, continues to tout its diverse faculty. However, NC State’s faculty is less diverse than its students, with 72.1% identifying as white and 27.9% as nonwhite, according to ISA. Worse than this, NC State’s department heads are even less diverse, with only 15% making up a visible minority and 85% appearing white. NC State should present their data like Figures 4 and 5.
For NC State to have a partnership with one of the largest analytics companies in the world, SAS Institute, some of this data representation would make a grown statistician cry. Granted, plenty of people could make the argument that it’s just a marketing strategy and not anything sinister, but when the University continues to fail the needs of its BIPOC students while also not addressing the decline in the Black student population on campus, it’s no longer a marketing strategy. It’s tokenizing. NC State needs to care more about their nonwhite students than just pictures for a campus publication or a statistic for them to skew.