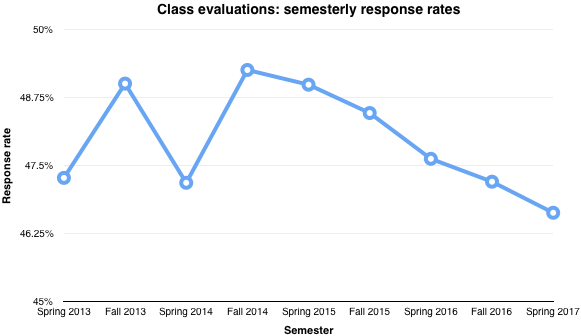

The response rate to ClassEval, the end-of-semester survey that students are asked to fill out evaluating their professors and classes, has been declining each semester since fall 2014, reaching a four-year low in spring 2017. Data provided by the Office of Institutional Research and Planning (OIRP) also shows that response rates since 2013 have always been below 50 percent. Technician evaluated OIRP’s* data for other significant trends.
Note that the source data is limited to evaluation responses for full semester courses during spring and fall semesters starting in 2013. It does not include data on summer courses or partial term courses. Also, note that this data is restricted to response rates; comments and ratings submitted by students are confidential at the individual level and are not included in this analysis.
Reminder emails
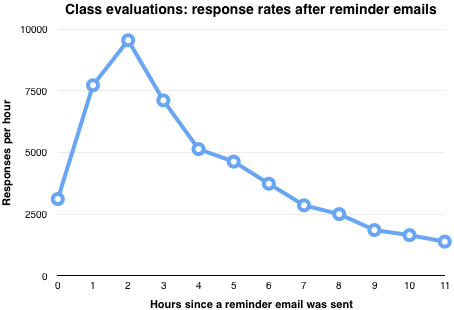
Reminder emails appear to be vital to gathering responses to class evaluations. Provided is a graph plotting the volume of responses submitted each hour against the time since the last reminder email was sent to the student body.
According to last semester’s data, about one-third of all responses are received in the three hours after a reminder email is sent. Half of all responses are recorded within five hours of a reminder email being sent.
About one-third of all completed class evaluations are submitted in the first 72 hours that the evaluations are open.
Top departments
Dating back to spring 2013, the earliest data available, Exploratory Studies (previously First Year College) and University Honors Program classes have each been in the top 10 percent in terms of response rates every semester. Since spring 2013, 65 percent of HON class evaluations and 69 percent of Exploratory Studies class evaluations (mainly USC courses) have been completed.
GTI (NC Global Training Initiative, currently only offering one course) and DDN (Design courses for graduate students) are the top departments for response rates. They have received 70 percent and 73 percent of their evaluation responses, respectively.
Record setting performances
In fall 2016, Christopher Parnin, an assistant professor in the Department of Computer Science, received a 100 percent response rate in all three classes he taught (159 responses in total). In the same semester, Parnin set the record for the largest section with a 100 percent response rate; all 97 students in his CSC 510 section (Software Engineering) completed the course evaluation.
In spring 2017, 83 sections reported a 100 percent evaluation response rate, which is the most sections in a single semester to receive all responses. Although an overwhelming majority sections that receive all responses have fewer than 25 students, one was an exception last semester; COM 230 (Introduction to Communication Theory) taught by Emily Winderman had 57 students and a 100 percent response rate.
Despite spring 2017 setting the record for most sections receiving all responses, it also set the record for the lowest overall response rate in a given semester. The provided chart details the changes in overall response rates each semester.
Lowest response rates
Among departments offering classes each semester, MS (Military Science), part of Army ROTC, has the lowest overall response rate, 26 percent. Since fall 2013, MS has been in the bottom 5 percent of all departments in terms of response rates every semester, and has gotten the lowest response rate each of the last two semesters (22 percent in spring 2017 and 18 percent in fall 2016).
TOX (Toxicology) classes also receive one of the lowest response rates. The Department of Toxicology has been in the bottom 10 percent each semester since fall 2014. Twenty-four percent of all the department’s class evaluations have been completed in that period.
Location, location, location
Most (61 percent last semester) class evaluations are completed on campus, and among those completed on campus, Tompkins Hall has been the most popular location as far back as 2013. Tompkins houses nearly every section of ENG 101 (Academic Writing and Research), which is a required class for all undergraduate students (unless certain testing requirements are met).
Tompkins is followed by Talley Student Union and D.H. Hill Library as next most popular (these three locations together accounted for 12 percent of all submissions last semester), and the dining halls are among the least popular locations on campus to complete class evaluations. According to official data, no class evaluations were completed by students while connected to Fountain Dining Hall’s Wi-Fi last semester.
* Editor’s note: this article originally misspelled the acronym for the Office of Institutional Research and Planning.